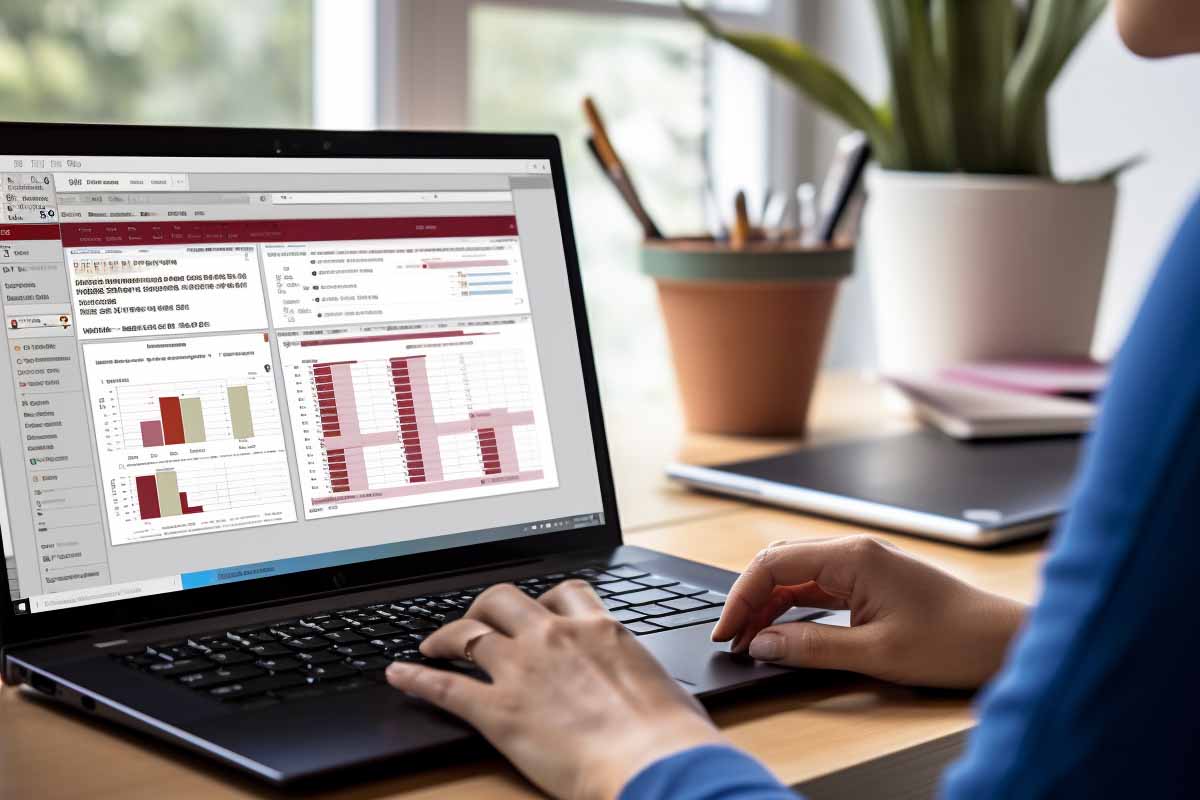
One stale PivotTable can throw off a sales report, a dashboard, or a weekly forecast. If the numbers in the source sheet changed but the summary did not, the problem is usually not the data itself. It is the refresh process.
This guide explains how to auto update excel sheet workflows and how to refresh PivotTables in Excel without guesswork. You will see why PivotTables hold on to cached data, how to refresh one table or every table in a workbook, when shortcuts help, and where VBA automation fits in.
If you have ever asked, “Why does my PivotTable still show old totals?” or searched for the auto update pivot table in excel approach, this post gives you the practical answer. You will also see how to avoid the common trap behind the query: an excel workbook tracks the sales data for a company. a pivot table is in the adjacent tab and provides a high level view of the sales by department. the sales numbers are updated in the workbook, but the pivot table is not reflecting these changes. what is most likely causing this problem?
Key Takeaway
PivotTables do not recalculate from source data in real time. If the source changes, you must refresh the PivotTable cache or the report will continue showing old results.
Why PivotTable Refreshing Matters
PivotTables are fast because they do not scan your source range every time you click a filter. Instead, Excel stores a snapshot of the source data in a Pivot Cache. That cache makes summaries responsive, but it also means the report can lag behind the worksheet when data changes.
That design matters whenever people use Excel for reporting. A manager may make decisions from a dashboard that still shows last week’s totals. A finance analyst may send an export that excludes new rows added after the last refresh. A sales team may think a department underperformed when the source sheet actually contains newer numbers that the PivotTable has not pulled in yet.
What changes require a refresh?
Any structural or data change in the source can affect the PivotTable summary. Common examples include:
- New rows added to the source range
- Edited values that change totals, counts, or averages
- Deleted records that should no longer appear
- Changed categories such as department names or product group labels
- New columns that contain fields you want to analyze
The key distinction is simple: changing the source data is not the same as updating the PivotTable view. If you want current reporting, you need a refresh habit, especially in recurring workbooks. Microsoft documents PivotTable behavior and refresh options in Microsoft Support and Microsoft Learn.
“A PivotTable is only as current as its last refresh.” That single idea explains most stale-report problems in Excel.
How PivotTables Work Behind the Scenes
To understand why refreshing matters, you need the moving parts. A PivotTable is tied to a source range, which is the data Excel reads from, and a Pivot Cache, which is the stored copy Excel uses to build the summary. The table you see on the sheet is the output of that cache, not a live view of every worksheet edit.
That is why Excel may still show old values after someone edits the source sheet. The numbers in the worksheet changed, but the cache has not been updated yet. Until you refresh, the PivotTable continues using the previous snapshot.
Why shared caches matter
Excel can allow multiple PivotTables to share the same cache. That is useful because it can reduce file size and keep reports aligned. If one cache drives three reports, a single refresh can update all three at once. The tradeoff is that a bad source definition or stale cache affects every report connected to it.
This behavior also affects performance. Large caches increase workbook size and can slow opening, saving, and refreshing. In large models, refresh timing becomes a planning issue, not just a convenience issue. The official Excel documentation from Microsoft explains how PivotTables relate to source data and refresh operations in detail at Microsoft Learn.
Note
If your workbook uses multiple PivotTables from the same dataset, one refresh can update more than one report. That is efficient, but it also means source problems can spread quickly.
Manual Refresh Methods in Excel
The fastest way to fix a stale PivotTable is still the manual refresh. For a single report, this is usually all you need. It is also the simplest method to verify because you can immediately compare the refreshed totals against the source data.
Refresh one PivotTable
Click anywhere inside the PivotTable. Excel should show the PivotTable Analyze tab on the Ribbon. From there, use the Refresh button. You can also right-click inside the PivotTable and choose Refresh from the context menu.
- Select the PivotTable.
- Go to PivotTable Analyze.
- Click Refresh.
- Check totals, row labels, and filters right away.
This is practical for ad hoc analysis, small workbooks, or one-off corrections after someone edits the source data. If you only have one report and the source range is stable, manual refresh is usually the least risky option.
When manual refresh is the right choice
- Small workbooks with one or two PivotTables
- Ad hoc analysis where you need a quick update before presenting
- Controlled source edits made by one person
- Validation work where you want to confirm numbers step by step
One habit saves time: after every refresh, compare the new output to the source sheet or a control total. That catches source-range issues early. The general behavior is documented through Microsoft Excel support resources and the main Excel help pages.
Refreshing Multiple PivotTables At Once
If a workbook contains dashboards, supporting summaries, and detail reports, refreshing one PivotTable at a time is slow and error-prone. In that case, use Refresh All. This tells Excel to update every connected PivotTable and, in many cases, other data connections in the workbook.
You can usually find Refresh All on the Data tab. It also appears in PivotTable-related Ribbon areas, depending on the selected object. The benefit is consistency. If three reports depend on the same sales dataset, you want them all updated from the same source snapshot.
When Refresh All is better than one-table refresh
Use Refresh All when your workbook contains linked summaries, charts driven by PivotTables, or multiple sheets that roll up the same data. This is especially useful for monthly reporting packs. If one tab is refreshed and another is not, the workbook becomes internally inconsistent, which is worse than being slightly out of date.
Still, do not assume every report updated correctly just because the command completed. Check the major summary tabs after the refresh. Look for totals that match across sheets, filter selections that stayed intact, and field names that still display correctly. Microsoft’s Excel documentation and support pages cover workbook refresh behavior and connection management on Microsoft Learn.
| Single PivotTable Refresh | Best for small edits, quick checks, and one-off analysis. |
| Refresh All | Best for dashboards, multi-sheet reports, and shared source data. |
Keyboard Shortcuts And Faster Workflow Options
Shortcut-driven workflows matter when you refresh reports several times a day. The Alt+F5 refresh pivot table shortcut is one of the fastest ways to update the active PivotTable context without hunting through Ribbon tabs. It is a small efficiency gain, but repeated throughout the day it adds up.
For broader updates, use Refresh All instead of refreshing each table separately. That is the right move when you know the workbook contains multiple dependent views. If you only need a single table, the shortcut is faster and less distracting.
Speed up repeat reporting
- Add Refresh All to the Quick Access Toolbar for one-click access
- Use keyboard navigation to move directly into the PivotTable before refreshing
- Build a repeatable check routine after each refresh, such as comparing totals and filters
- Keep related reports together so you can verify them in sequence
That is the practical answer to people searching for auto update excel sheet behavior without necessarily using code. You are not making Excel truly real-time, but you are reducing the time between source changes and report updates.
Pro Tip
If you refresh the same workbook every day, put Refresh All on the Quick Access Toolbar. It saves more time than most people expect, especially in reporting-heavy roles.
Using VBA To Automate PivotTable Refreshes
VBA is the right tool when a workbook needs repeated refreshes, multiple sheets, or a standardized update process. It is especially useful for monthly reporting files, team dashboards, and models that pull from regularly updated data dumps.
Instead of clicking refresh on each sheet, a macro can loop through every worksheet and refresh each PivotTable automatically. In simple terms, the code checks one sheet at a time, looks for PivotTables, and tells each table to refresh. That is a practical route if you are trying to build a more complete auto update pivot table in excel process.
What the macro is doing
A typical refresh macro does three things:
- Loops through each worksheet in the workbook.
- Checks whether that worksheet contains PivotTables.
- Runs the refresh command for every PivotTable it finds.
That approach is useful because it centralizes the update. If the workbook has ten tabs and six summaries, one macro can update them all. For many analysts, that means fewer manual steps and fewer missed refreshes.
When automation makes sense
- Recurring reports that always follow the same structure
- Multi-sheet dashboards with many linked PivotTables
- Standardized handoffs where one person prepares the workbook for another
- Scheduled reporting where the file is updated before distribution
Test any macro on a copy of the workbook before using it in production. That matters because a refresh can fail if the source range moved, a field was renamed, or a connection changed. Microsoft documents VBA and PivotTable object model behavior in Excel VBA reference.
Automation does not replace good data discipline. It only makes good habits repeatable.
Best Practices For Reliable Data Refresh
A clean refresh starts with clean source data. If the source sheet has blank rows, inconsistent headers, merged cells, or mismatched categories, the PivotTable can still refresh but produce misleading output. In practice, most refresh problems are data-structure problems, not refresh-command problems.
One of the best habits is using an Excel Table as the source. Tables expand more reliably when new records are added, which helps avoid the common issue where a PivotTable keeps pointing to the old range. That is one of the easiest ways to make an auto update excel sheet workflow more dependable.
Source data checks before refreshing
- Use consistent column headers with no duplicates
- Avoid blank rows in the middle of the dataset
- Keep field values standardized such as “Sales” versus “sales”
- Verify formulas return values for all rows
- Convert ranges to Tables when data is expected to grow
Refresh after major imports or edits, not just at the end of a reporting cycle. If you wait too long, small source problems stack up and become harder to isolate. After each refresh, validate totals, filters, and calculated fields. That simple review catches missing rows, incorrect groupings, and broken references before the report reaches management.
Warning
A successful refresh does not always mean a correct report. If the source range is wrong or the headers changed, Excel may update cleanly while still showing incomplete data.
Troubleshooting Common Refresh Problems
If your refreshed PivotTable still does not change, the first thing to check is the source range. The most common cause is that the PivotTable still points to an older range that does not include the new rows. That is often the real answer behind the query about why updated sales numbers do not appear in the adjacent PivotTable.
Next, confirm that the PivotTable is connected to the correct data source. If the workbook uses an Excel Table, check that the table grew correctly after the new data was added. If it uses a fixed range, you may need to change the source definition manually.
Common causes of refresh failures
- Source range did not expand after new rows were added
- Column names changed and no longer match the cached field names
- Fields were deleted from the source sheet
- Filters or slicers are hiding part of the updated data
- Grouping settings are preventing new items from showing as expected
- Cache issues are persisting after repeated edits
If refreshes fail repeatedly, rebuild the PivotTable or reconnect the source data. That sounds heavy-handed, but it is often faster than spending an hour chasing a damaged cache. Microsoft’s official troubleshooting guidance and PivotTable documentation on Microsoft Support are the best starting point for diagnosing source and cache issues.
How to tell whether the problem is data or display
Check whether the source sheet itself shows the right values. If the source is correct but the PivotTable is wrong, the issue is usually cache, source range, or filtering. If the source is wrong, the PivotTable is only reflecting a deeper problem upstream.
That is why troubleshooting should always begin with the data, then move to the PivotTable, then the workbook structure. Skipping straight to VBA or rebuilding the report often wastes time.
Refreshing PivotTables In Shared Or Large Workbooks
Large files and shared workbooks need more planning because refresh time grows with dataset size, number of tables, and connection complexity. A workbook that opens in seconds on a local laptop may take much longer on a network drive or with several connected summaries.
In a shared environment, another user may change the source data while you are preparing a report. That creates timing issues. A refresh can pull in half-updated records, or it can update before all edits are complete. To avoid that, coordinate refresh windows and define when source edits are considered final.
Practical refresh timing strategies
- Refresh before meetings so the deck reflects the latest numbers
- Refresh before exports so external files are accurate
- Use a backup copy before refreshing very large or critical workbooks
- Schedule updates after all source inputs are complete
- Validate the highest-risk reports first instead of checking every tab in random order
Workforce and reporting roles increasingly depend on accurate data handling, and the U.S. Bureau of Labor Statistics notes continued demand for data and analytics-related roles in its occupational outlook resources at BLS. For teams managing operational reporting, that makes reliable refresh processes part of everyday quality control, not a niche Excel skill.
Conclusion
Refreshing PivotTables is not optional if the source data changes. Without a refresh, Excel keeps showing the cached version of your data, which can lead to bad totals, inconsistent dashboards, and misleading reports. That is true whether you are updating one summary or an entire workbook.
The most useful methods are straightforward: refresh a single PivotTable when you only changed one report, use Refresh All when multiple summaries share the same data, apply shortcuts like Alt+F5 when you need speed, and use VBA when repetitive updates justify automation. If you are trying to build a reliable auto update excel sheet workflow, start with clean source data, an Excel Table where possible, and a consistent validation habit after every refresh.
When a report looks wrong, do not assume Excel is broken. Check the source range, the cache, the filters, and the field names. Most refresh issues are fixable in minutes once you know where to look. For teams that rely on Excel for daily reporting, a simple refresh is often the difference between accurate analysis and avoidable mistakes.
Next step: audit one of your recurring Excel reports today. Confirm the source range, test Refresh All, and verify the totals before the workbook goes out the door.
Microsoft® and Excel are trademarks of Microsoft Corporation.
